Start with the exam
What you need to be able to do
This is the legacy Statistics option, not a compulsory current AA HL revision chapter. Its old questions combine inference, sampling distributions, confidence intervals and goodness-of-fit with probability and moment calculations. Use supplied definitions when exploring it. The transferable habit is to state the variable, assumptions and comparison being made before evaluating a formula; a significance result is an evidence statement, not proof of a claim.
Spend 3 minutes reading the overview and diagram, 7 minutes learning the question patterns, 5 minutes writing out the worked example, and 5 minutes on a bank question or recall check. Take longer when you need to; the full bank is here for later practice.
This collection contains content outside the current course, or a mixture of current and legacy skills. Use the compatibility note for each original question to decide which parts to practise for your exam.
Recognise → set up → write
How the questions are set
Sampling means and confidence intervals
Recognise it: An old part asks for an interval estimate or required sample size.
- Distinguish population spread from the standard error of a sample mean. For independent observations with variance σ², Var(X̄)=σ²/n.
- With a known population standard deviation and an appropriate normal sampling model, a z interval is x̄±z*σ/√n. Unknown spread often requires a t method with its assumptions and degrees of freedom.
- For sample size, solve the margin-of-error inequality and round up. Check whether the model justifies the normal or t reference distribution.
State the estimator, standard error and critical value separately; identify the confidence level.
A confidence level describes the procedure’s long-run coverage, not a probability assigned to a fixed parameter after observing this specific interval.
Compare means with a test
Recognise it: A legacy question asks whether evidence supports a population difference.
- Write H₀ and H₁ in population parameters, including whether the alternative is one- or two-sided.
- Choose the supplied test model and standard error. For pooled two-sample t methods, the equal-population-variance assumption matters; do not pool automatically.
- Calculate the test statistic and a p-value or critical comparison. State a contextual conclusion at the chosen significance level, using insufficient evidence when H₀ is not rejected.
Show hypotheses, test statistic, comparison and conclusion in context.
Failure to reject H₀ does not prove equality. The p-value is calculated under H₀ and is not P(H₀ is true).
Goodness-of-fit and independence
Recognise it: Observed category frequencies are compared with a proposed model.
- Compute expected frequencies from model probabilities, or for a contingency table use row total×column total/grand total.
- Use χ²=Σ(O−E)²/E. Pool categories when required by the expected-frequency conditions, preserving a coherent model and updating the degrees of freedom.
- For goodness-of-fit, account for estimated parameters when determining degrees of freedom. For a standard r by c independence table, use (r−1)(c−1), subject to the test assumptions.
Show an expected-frequency calculation and explain any pooling before reporting the statistic.
Expected frequencies are not necessarily equal. Parameters fitted from the same data reduce available degrees of freedom.
Write it before you reveal it
A worked exam-style example
Original teaching example, created for this lesson.
Original extension example: a fair coin is tossed 40 times, giving 26 heads and 14 tails. Calculate the chi-squared goodness-of-fit statistic against equal probabilities.
Reveal the worked solution
- Under the proposed model, each expected count is 20.
- The head contribution is (26−20)²/20=1.8.
- The tail contribution is (14−20)²/20=1.8.
- The sum is χ²=3.6. A significance conclusion would additionally require the chosen level and reference distribution.
Answer: χ²=3.6.
Check: The two opposite deviations have equal squared contributions; observed and expected totals both equal 40.
From your own collection
Apply it to past-paper questions
These questions anchor the patterns above. Attempt one without the answer, then compare your setup and conclusion with the reasoning. The linked reader contains the source answer and the question-specific syllabus review.
Question 1550
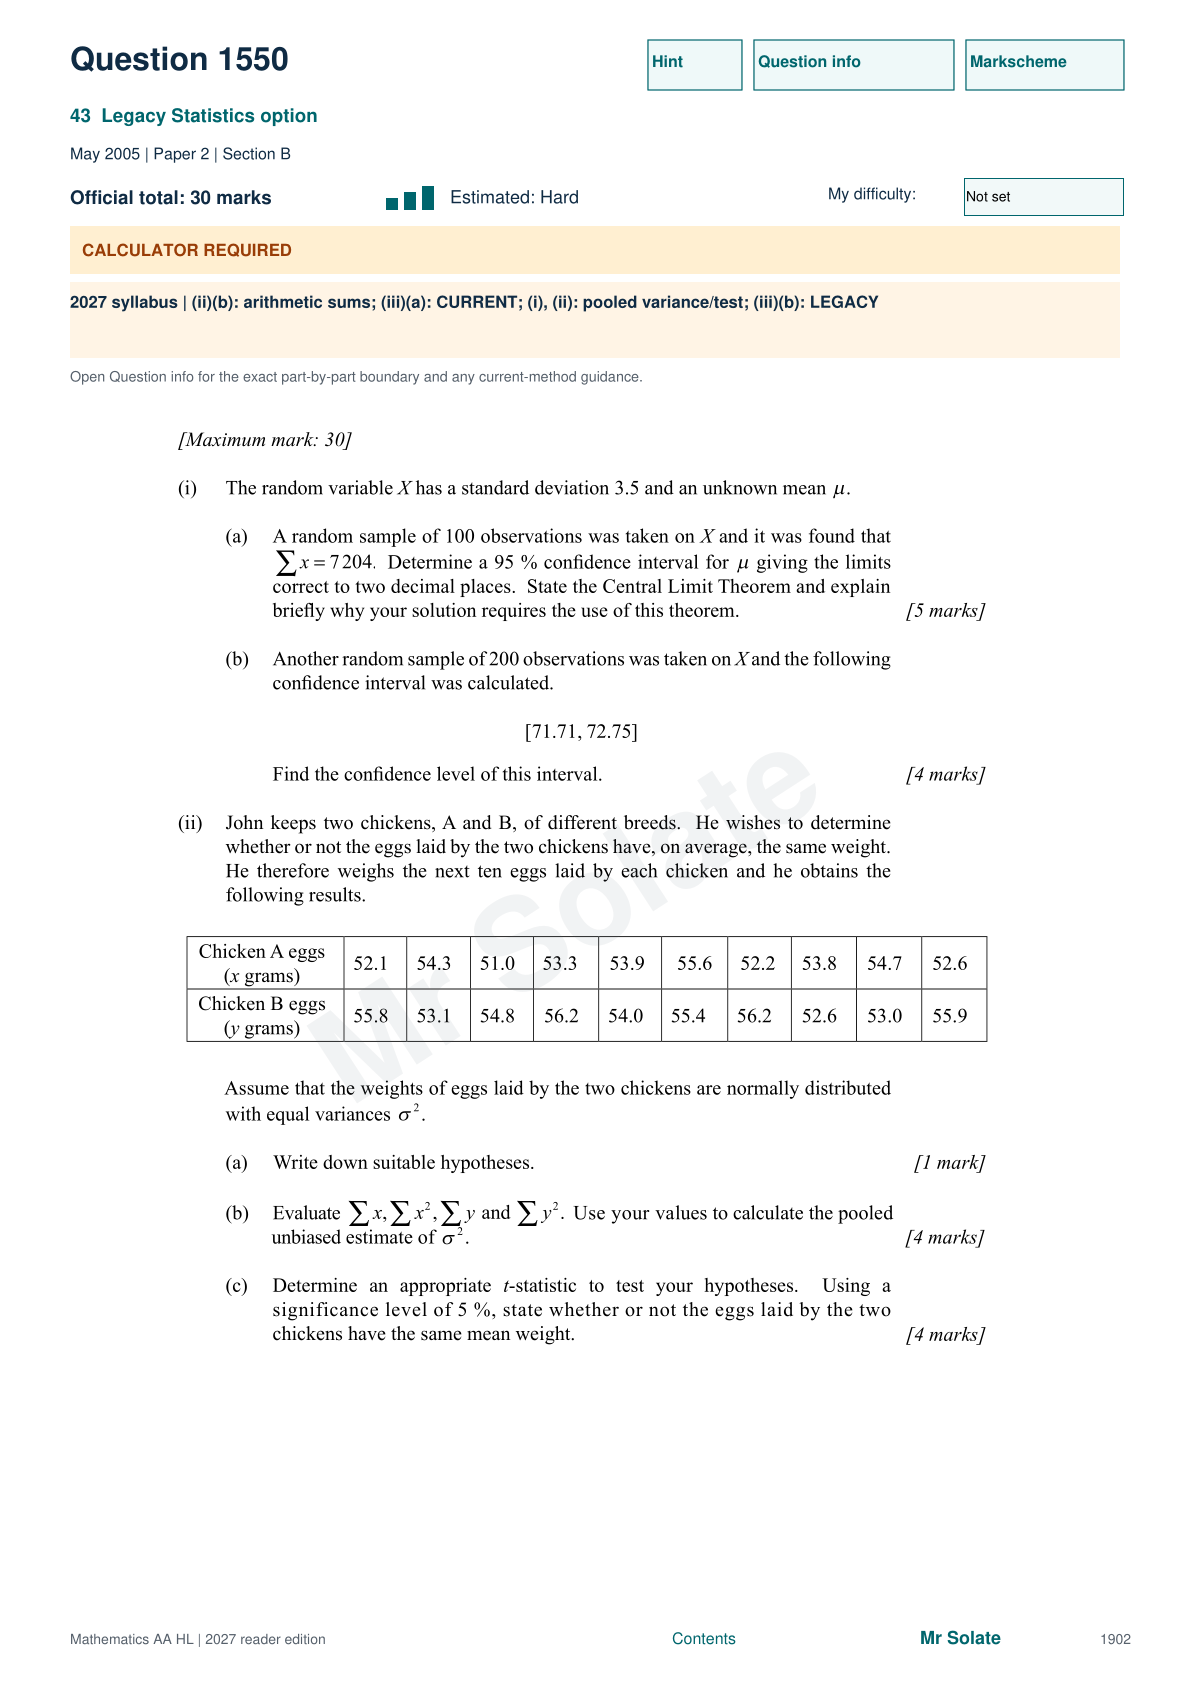
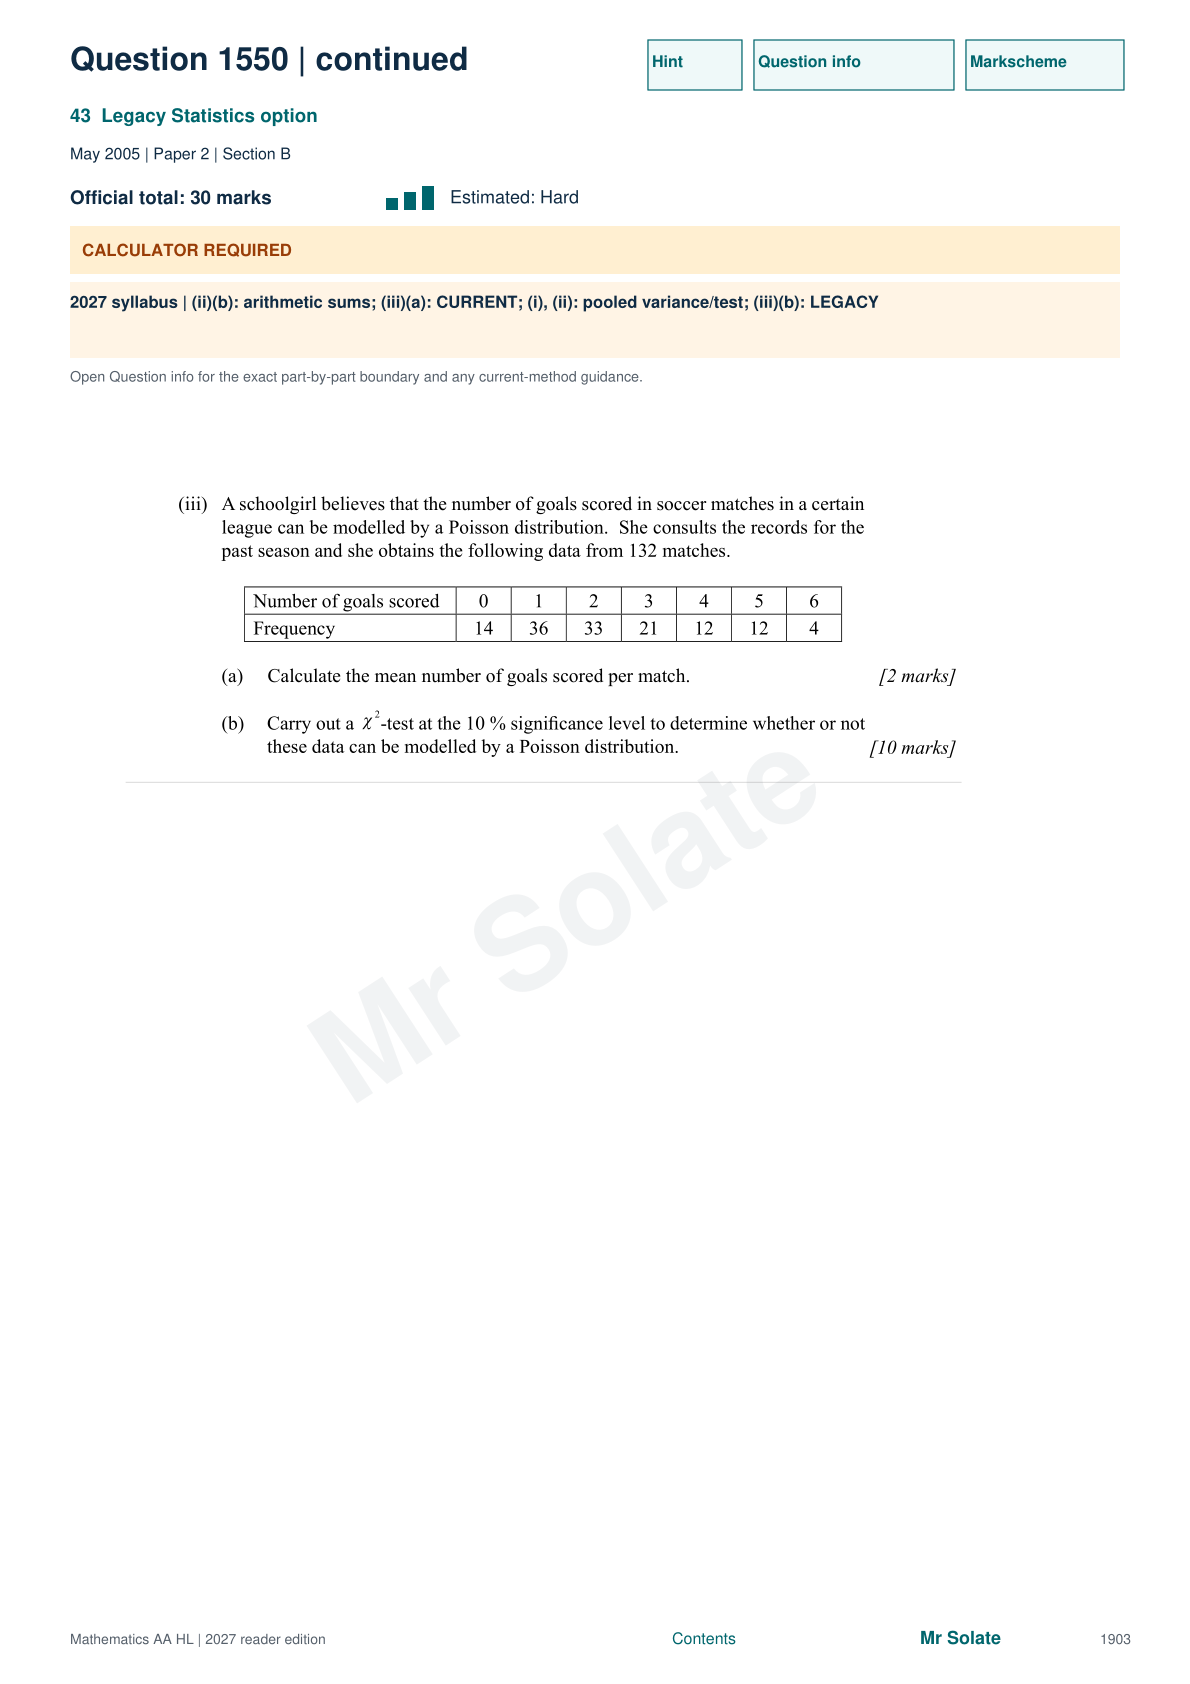
Extended reasoning linking Central limit theorem and confidence intervals (i), Pooled two-sample t-test (ii), Fitted Poisson goodness-of-fit (iii).
Compatibility: Current: (ii)(b): arithmetic sums; (iii)(a); Legacy: (i), (ii): pooled variance/test; (iii)(b)
View the original question
Original page images preserve the equations and diagrams. Write your response before revealing the reasoning.
Reveal the revision reasoning
- The first sample mean is72.04 and standard error3.5/10=0.35; the95% interval is[71.35,72.73]. For independent identically distributed observations with finite variance, the central limit theorem makes a large-sample mean approximately normal.
- For the second interval, half-width0.52=z×3.5/√200 gives z≈2.101 and confidence2Φ(z)−1≈96.4%.
- For eggs, use H₀:μ_A=μ_B against a two-sided alternative. The sums are533.5,547 and squared sums28479.49,29938.9.
- Subtract each squared total divided by10 and pool over18 degrees of freedom, obtaining variance1.95917. The statistic2.16 has p≈0.045, supporting unequal means at5%.
- For goals, the fitted Poisson mean is2.25. Include the entire upper tail beyond5 when forming expected frequencies, then combine5 and6-or-more.
- Six resulting categories minus one total constraint and one estimated parameter give4 degrees of freedom; χ²≈5.66<7.779, so do not reject at10%.
Editorial revision reasoning. Check the original answer for its marking detail.
Question 1549
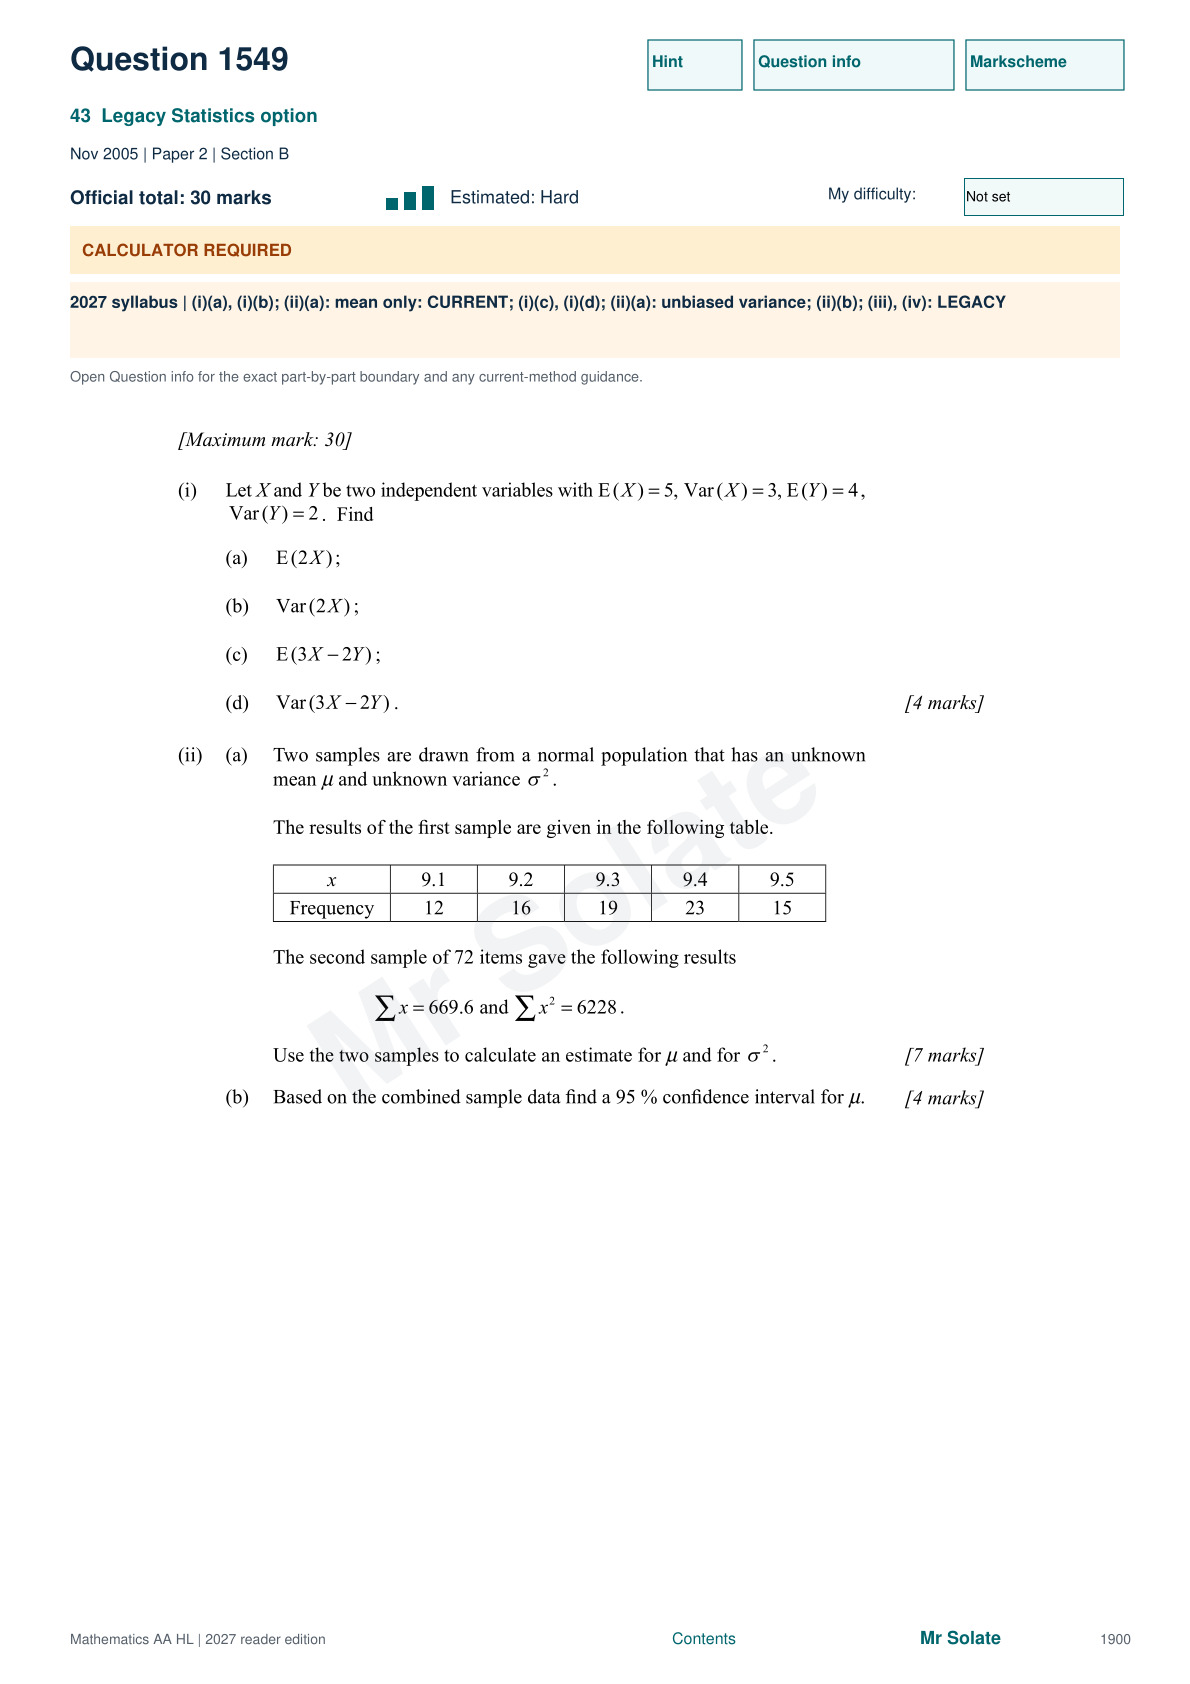
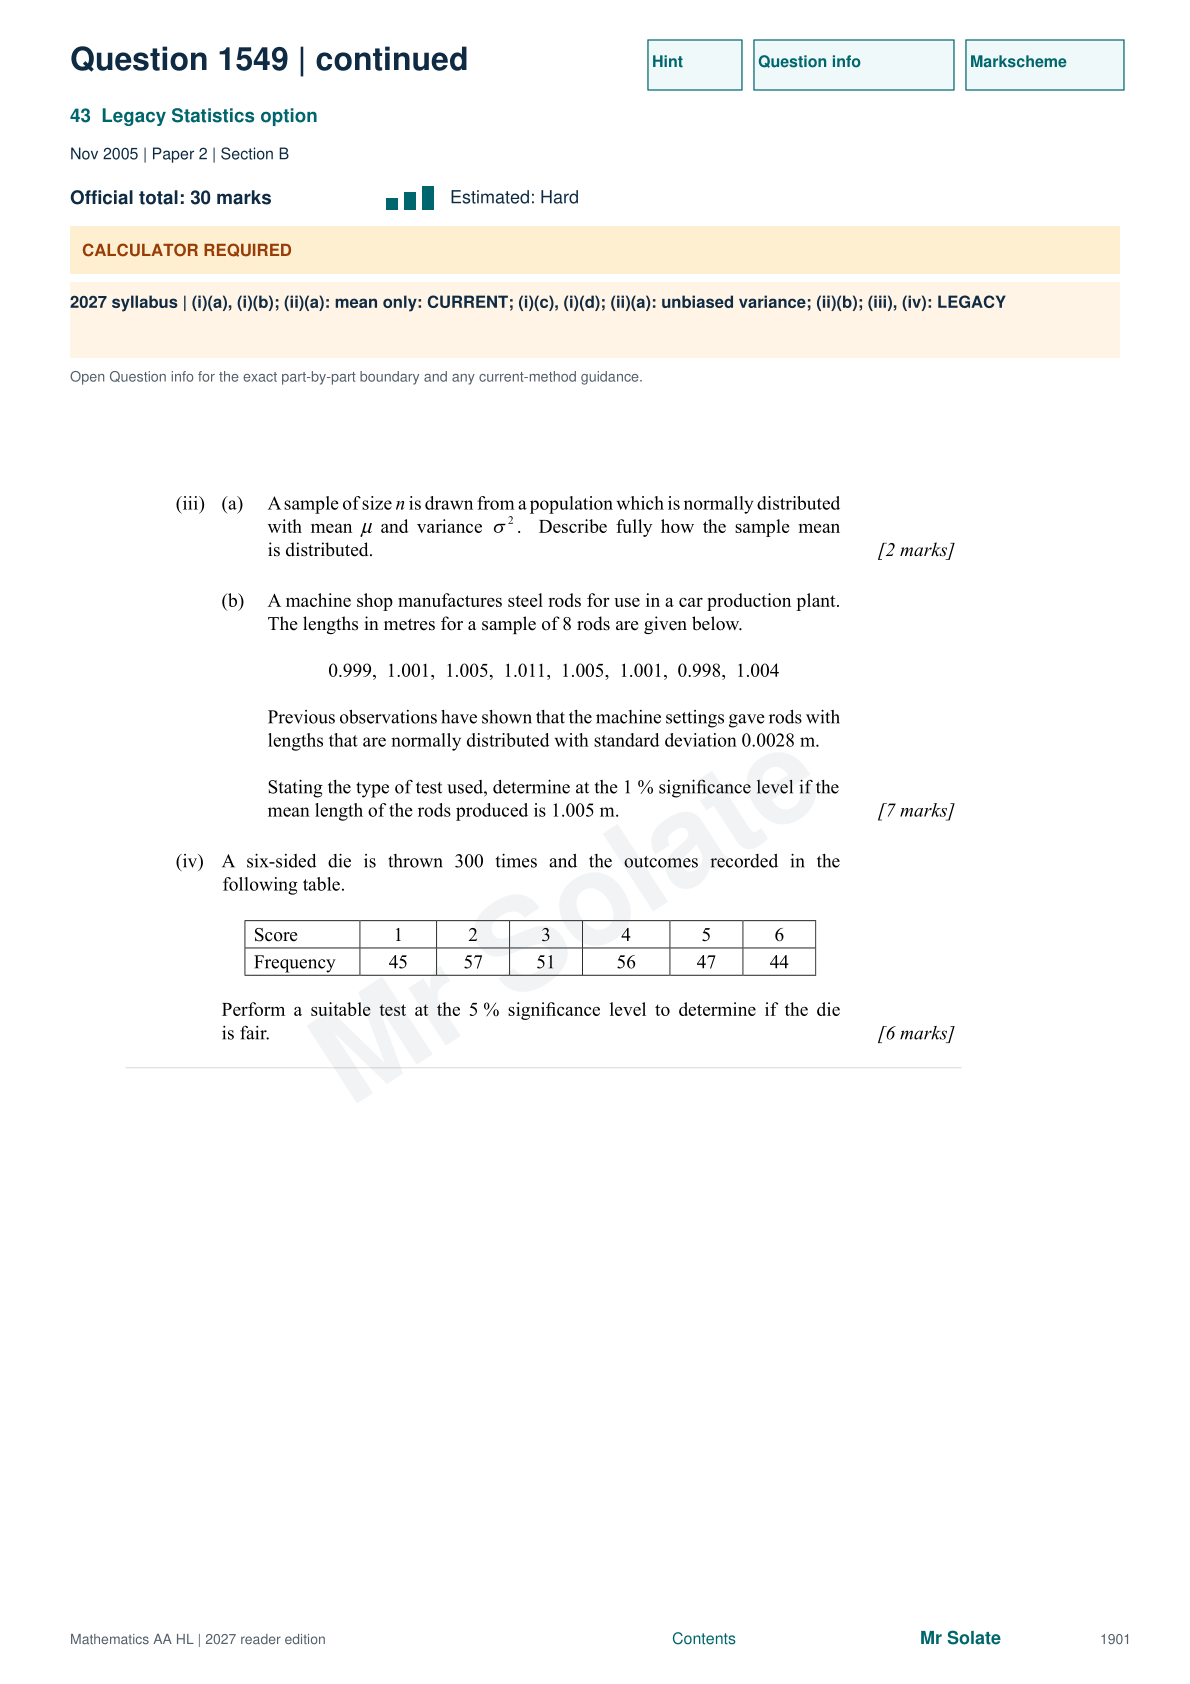
Extended reasoning linking Expectations and variances of linear combinations (i), Combining sample summaries (ii), Sampling distribution and known-variance z-test (iii).
Compatibility: Current: (i)(a), (i)(b); (ii)(a): mean only; Legacy: (i)(c), (i)(d); (ii)(a): unbiased variance; (ii)(b); (iii), (iv)
View the original question
Original page images preserve the equations and diagrams. Write your response before revealing the reasoning.
Reveal the revision reasoning
- Linearity gives E(2X)=10 and E(3X−2Y)=7. Independence gives Var(2X)=12 and Var(3X−2Y)=9×3+4×2=35.
- For the combined sample, n=157, Σx=1461.4 and Σx²=13605.3. Hence x̄≈9.3083 and s²=[13605.3−1461.4²/157]/156≈0.01396.
- Use t with156 degrees of freedom and standard error√(s²/157) to obtain the95% interval approximately(9.29,9.33).
- For a normal population, the sample mean is exactly normal with meanμ and varianceσ²/n.
- Rod SD0.0028 is known, so use a two-sided z-test of μ=1.005. With x̄=1.003, z≈−2.02 and p≈0.0434: insufficient evidence at1%.
- For the die, each expected count is50; χ²=3.12 with5 degrees of freedom is below11.07, so fairness is not rejected at5%.
Editorial revision reasoning. Check the original answer for its marking detail.
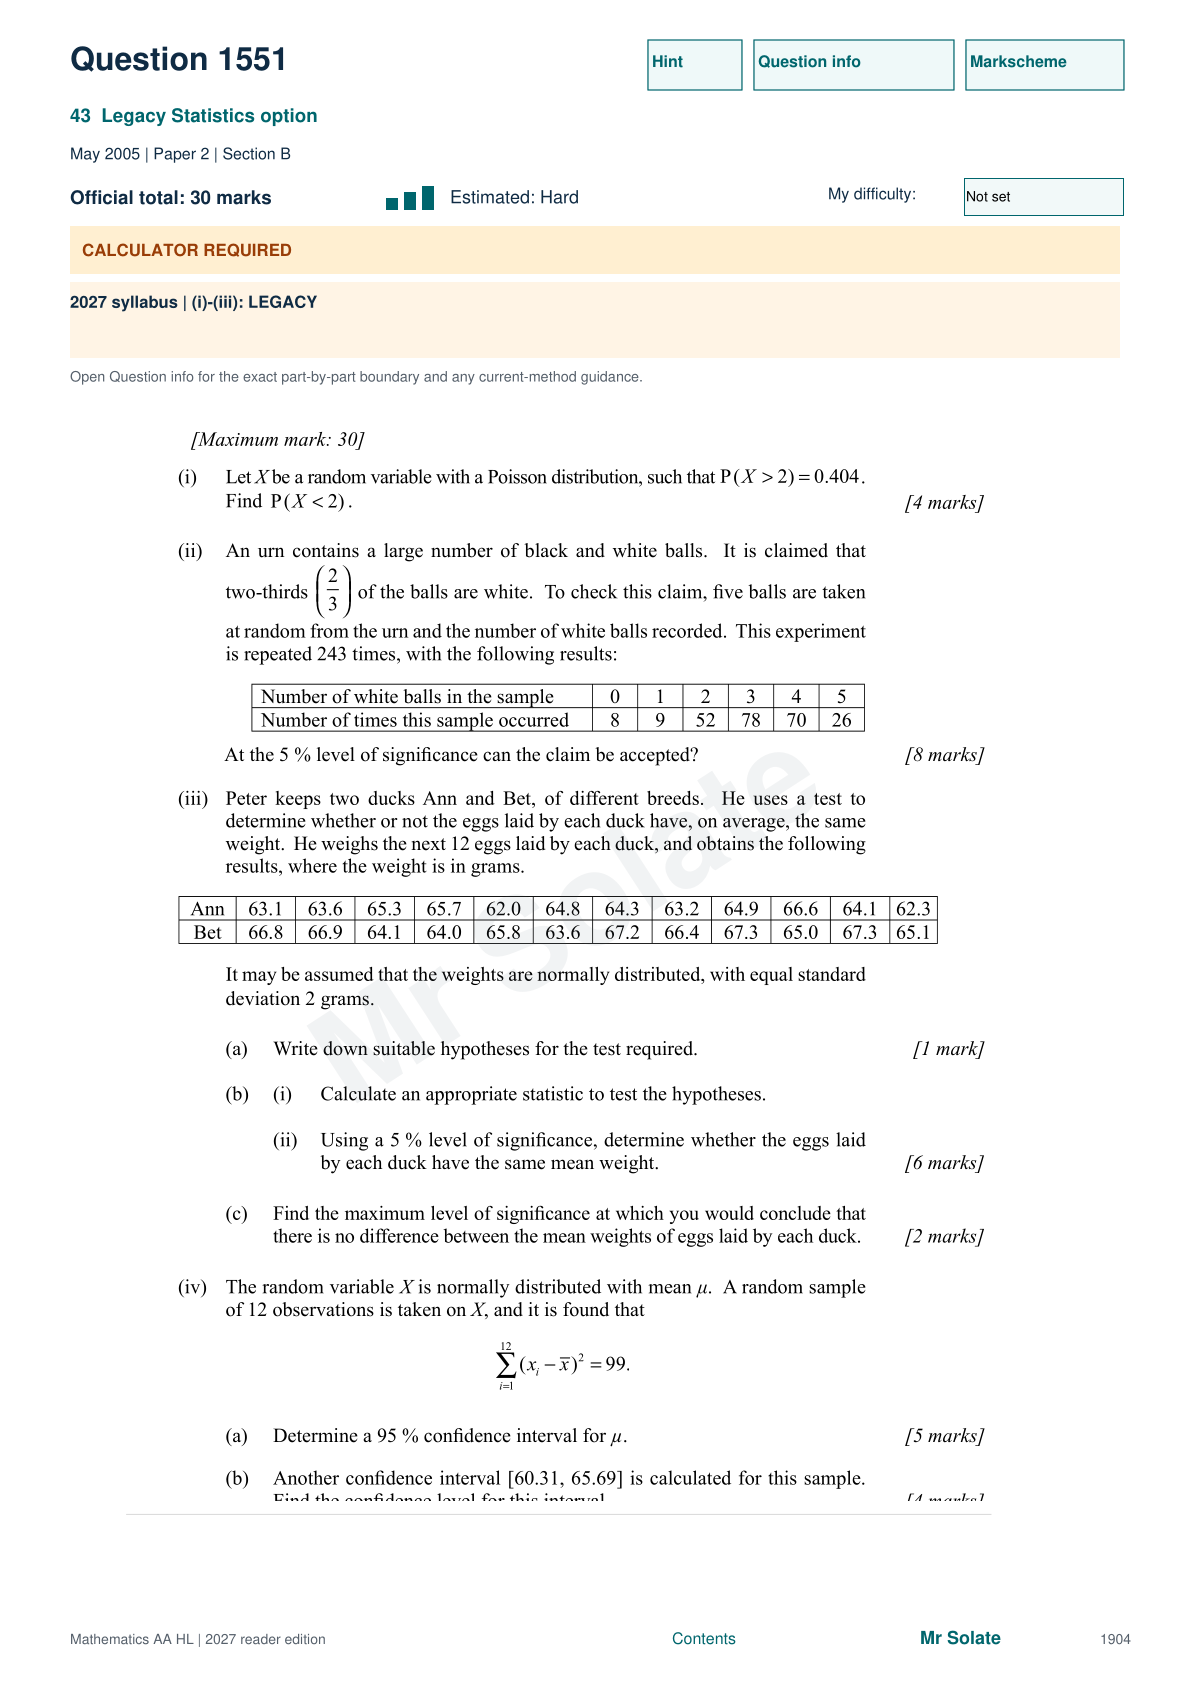
Question 1551
Extended reasoning linking Recovering a Poisson parameter (i), Binomial goodness-of-fit (ii), Known-variance two-sample z-test (iii).
Compatibility: Legacy: (i)–(iii)
View the original question
Original page images preserve the equations and diagrams. Write your response before revealing the reasoning.
Reveal the revision reasoning
- Solve exp(−λ)(1+λ+λ²/2)=0.596 numerically to get λ≈2.30. Then P(X<2)=exp(−λ)(1+λ)≈0.331.
- Under the urn claim, Bin(5,2/3) gives expected counts1,10,40,80,80,32. Pool0 and1, giving χ²≈9.298 with4 degrees of freedom, below9.488; do not reject at5%.
- For ducks, known population SD2 means a two-sample z-test. The mean difference is about1.633 and standard error2√(1/12+1/12), giving z≈2.00.
- The two-sided p-value≈4.55% is below5%, supporting unequal mean weights. It is the decision threshold: levels below it fail to reject, subject to the equality convention.
- For the last sample, s²=99/11=9 and t₁₁=2.201 gives x̄±1.91.
- The other interval has half-width2.69, corresponding to t≈3.106 and99% confidence.
Editorial revision reasoning. Check the original answer for its marking detail.
All 12 questions in this topic
Close your notes first
Can you retrieve the method?
1. Standard error of a mean with known σ?
Check answer 1
σ/√n.
2. Does non-rejection prove H₀?
Check answer 2
No; it means insufficient evidence against it at that level.
3. What enters each chi-squared denominator?
Check answer 3
The expected frequency.
Before you move on
- Keep this chapter marked as legacy extension.
- Separate a statistic calculation from a full inferential conclusion.
- Check assumptions, degrees of freedom and whether the alternative is one-sided.
Your revision note
Record one missed cue, one corrected step and one question to retry. Saved only in this browser.