Start with the exam
What you need to be able to do
Statistics questions demand the correct denominator and the correct interpretation of the data. The bank combines frequencies, cumulative curves, outliers and regression. Decide whether a table shows ordinary frequencies or running totals before calculating a mean. For prediction, identify which variable is the response and choose the regression in that direction. Explain numerical results in context without claiming that correlation establishes causation.
Spend 3 minutes reading the overview and diagram, 7 minutes learning the question patterns, 5 minutes writing out the worked example, and 5 minutes on a bank question or recall check. Take longer when you need to; the full bank is here for later practice.
Recognise → set up → write
How the questions are set
Means, variance and missing values
Recognise it: A mean or standard deviation is given with missing observations or frequencies.
- Recover totals using Σx=n×mean; with frequencies use Σfx and n=Σf.
- For descriptive variance use Σfx²/n−mean². If a problem explicitly supplies a sample-estimator formula, follow that separate convention.
- For adding or removing observations, update n, the total and the sum of squares before recalculating.
Show the equations for the total and squared total when solving missing values.
A missing frequency changes both numerator and denominator. Do not confuse variance with standard deviation.
Cumulative data, quartiles and outliers
Recognise it: Read an ogive, box plot or grouped table.
- Difference consecutive cumulative counts to recover interval frequencies.
- Find quartiles at the appropriate cumulative positions and state any convention needed for a small discrete dataset.
- Calculate IQR=Q_3−Q_1 and fences Q_1−1.5IQR, Q_3+1.5IQR. Compare observations with the fences rather than labelling the maximum automatically as an outlier.
Label quartile values and the calculated fence before making an outlier judgment.
For a grouped mean use class midpoints and ordinary frequencies, not cumulative counts; the result is an estimate.
Regression and prediction
Recognise it: Paired data are supplied, or two regression equations appear.
- Identify the explanatory variable and response. To predict y from x, use regression of y on x.
- Keep pairs aligned in the data entry and report the fitted equation with meaningful variables.
- Interpret slope as predicted response change per input unit; use the model mainly within the observed input range and note that prediction is an estimate.
State which regression was selected before substituting the predictor.
The regression of x on y is generally not obtained by rearranging the regression of y on x.
Write it before you reveal it
A worked exam-style example
Original teaching example, created for this lesson.
Original practice: values 2,4,6 have frequencies 1,2,1. Find the mean and descriptive standard deviation.
Reveal the worked solution
- The total frequency is 4; Σfx=2+8+6=16, so mean=4.
- Σfx²=4+32+36=72. Descriptive variance=72/4−4²=2.
- Take the square root for standard deviation.
Answer: Mean=4; standard deviation=√2.
Check: The deviations are −2,0,0,2, whose squared total is 8. Dividing by 4 gives variance 2.
From your own collection
Apply it to past-paper questions
These questions anchor the patterns above. Attempt one without the answer, then compare your setup and conclusion with the reasoning. The linked reader contains the source answer and the question-specific syllabus review.
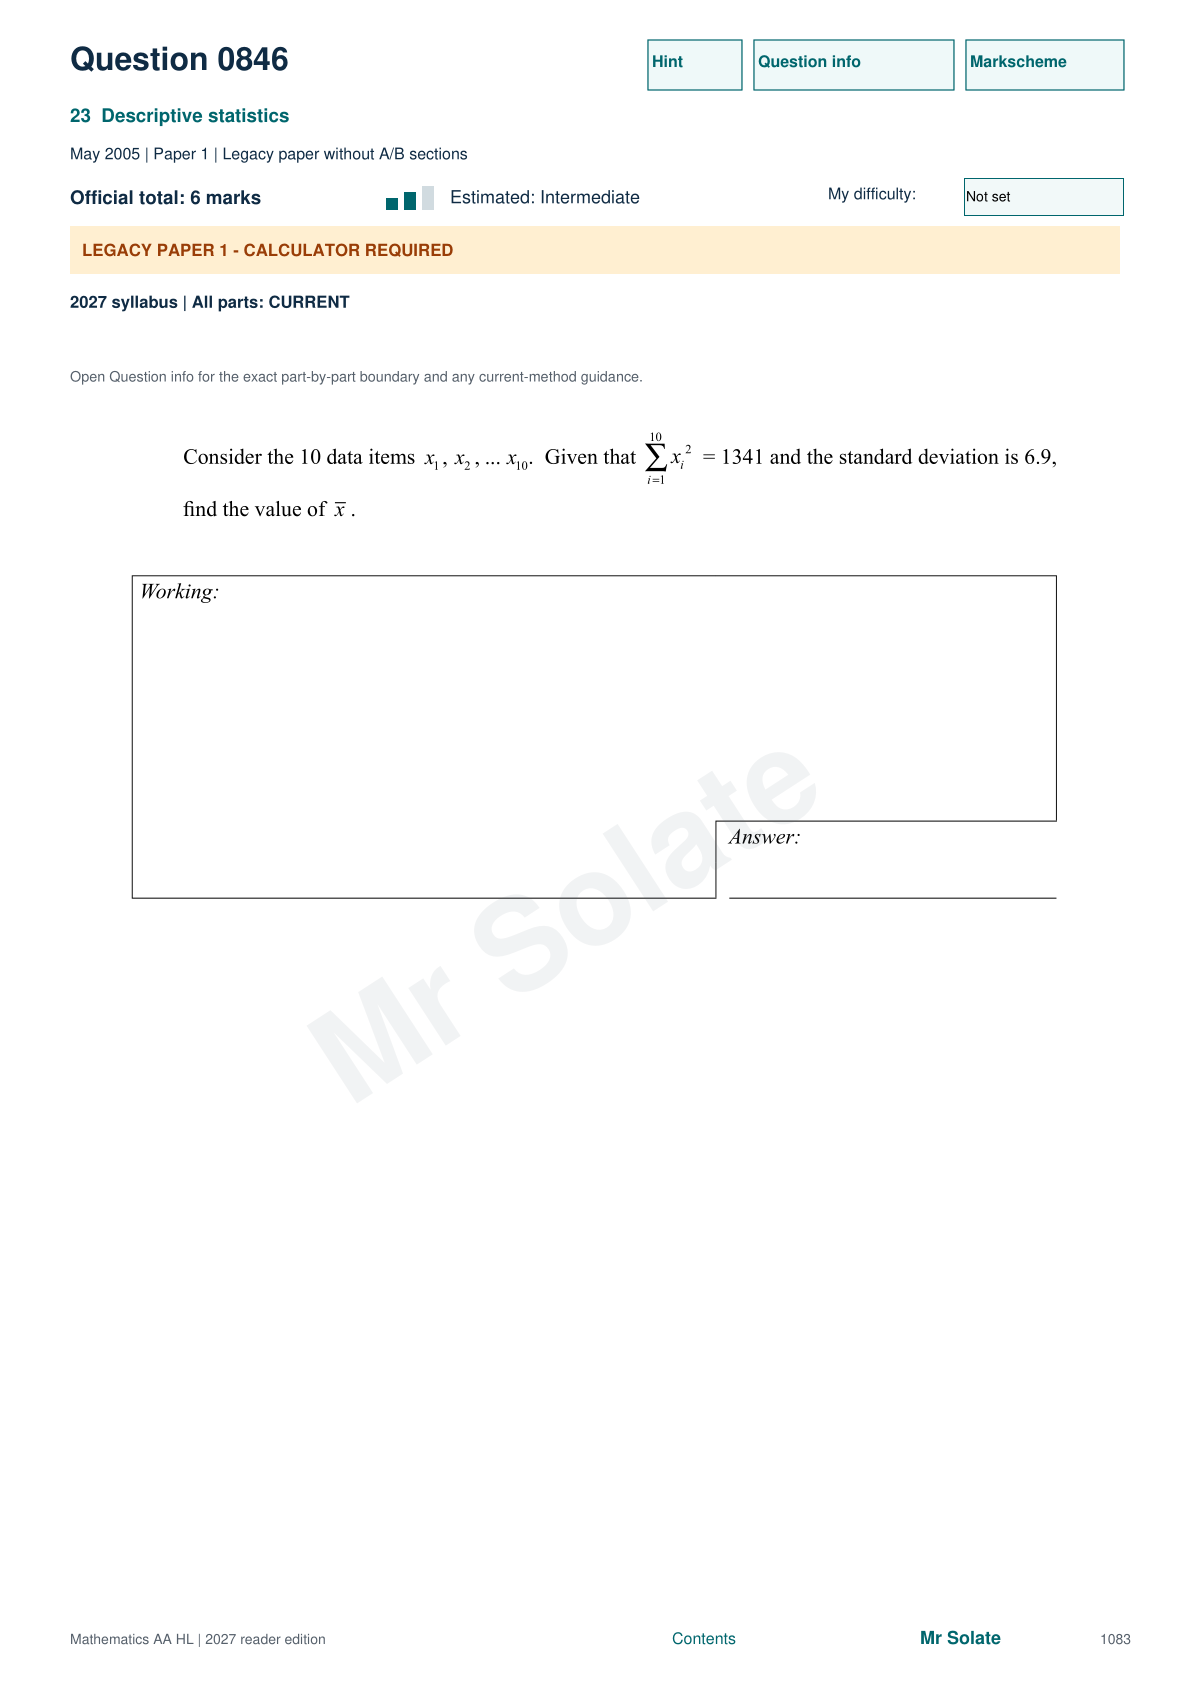
Question 846
Requires linking Variance identity, Recovering mean magnitude.
Compatibility: All parts: The tested methods are current AA HL: Variance identity, Recovering mean magnitude.
View the original question
Original page images preserve the equations and diagrams. Write your response before revealing the reasoning.
Reveal the revision reasoning
- The variance is 6.9².
- The mean of the ten squared observations is 1341/10.
- Rearrange σ²=1341/10−x̄² to find x̄².
- Take both possible square roots, since the data have not been restricted to positive values.
Editorial revision reasoning. Check the original answer for its marking detail.
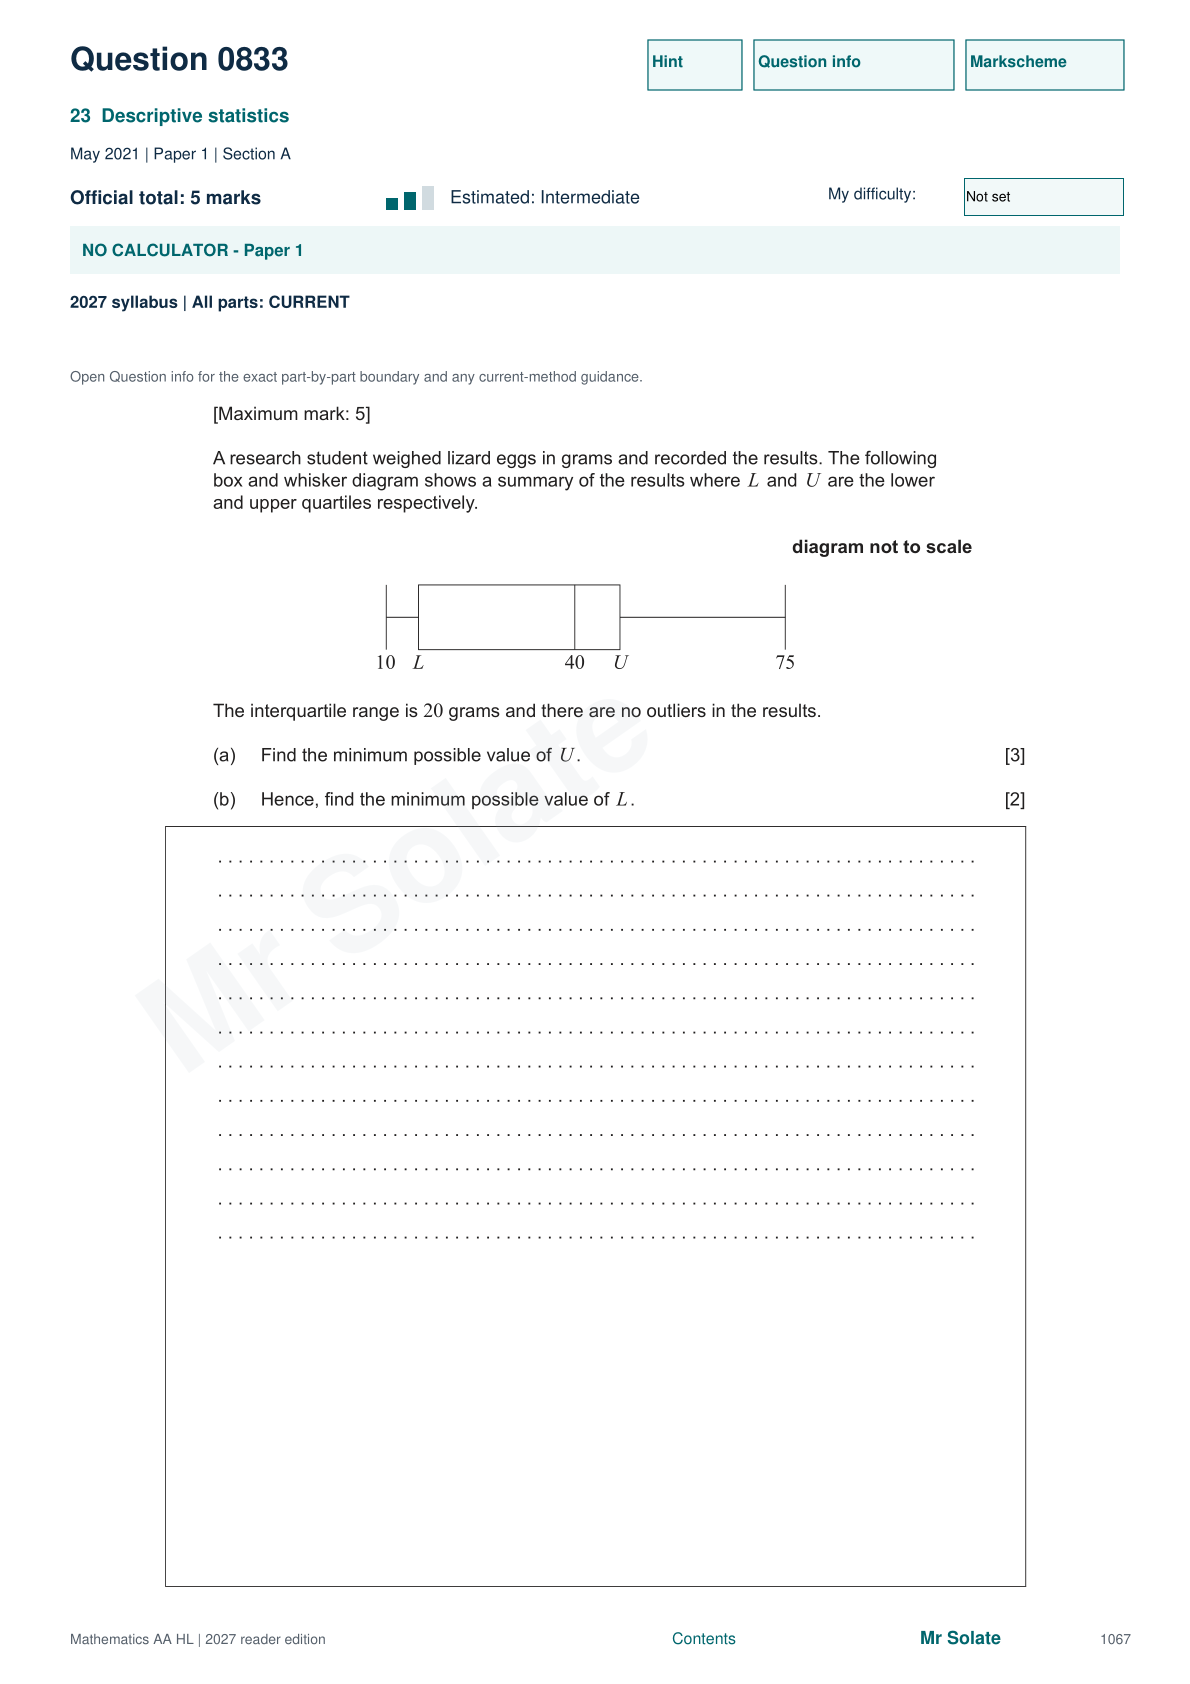
Question 833
Apply the method to the original question.
Compatibility: This is a current-course AA HL question; the listed concepts and methods remain in the 2027 exam syllabus.
View the original question
Original page images preserve the equations and diagrams. Write your response before revealing the reasoning.
Reveal the revision reasoning
No upper outlier means 75≤U+1.5(20)=U+30, so U≥45.
The smallest possible upper quartile is therefore U=45.
Since U-L=20, the corresponding minimum lower quartile is L=25.
This choice is compatible with the lower fence: L-30=-5, so the smallest observation 10 is not an outlier.
Editorial revision reasoning. Check the original answer for its marking detail.
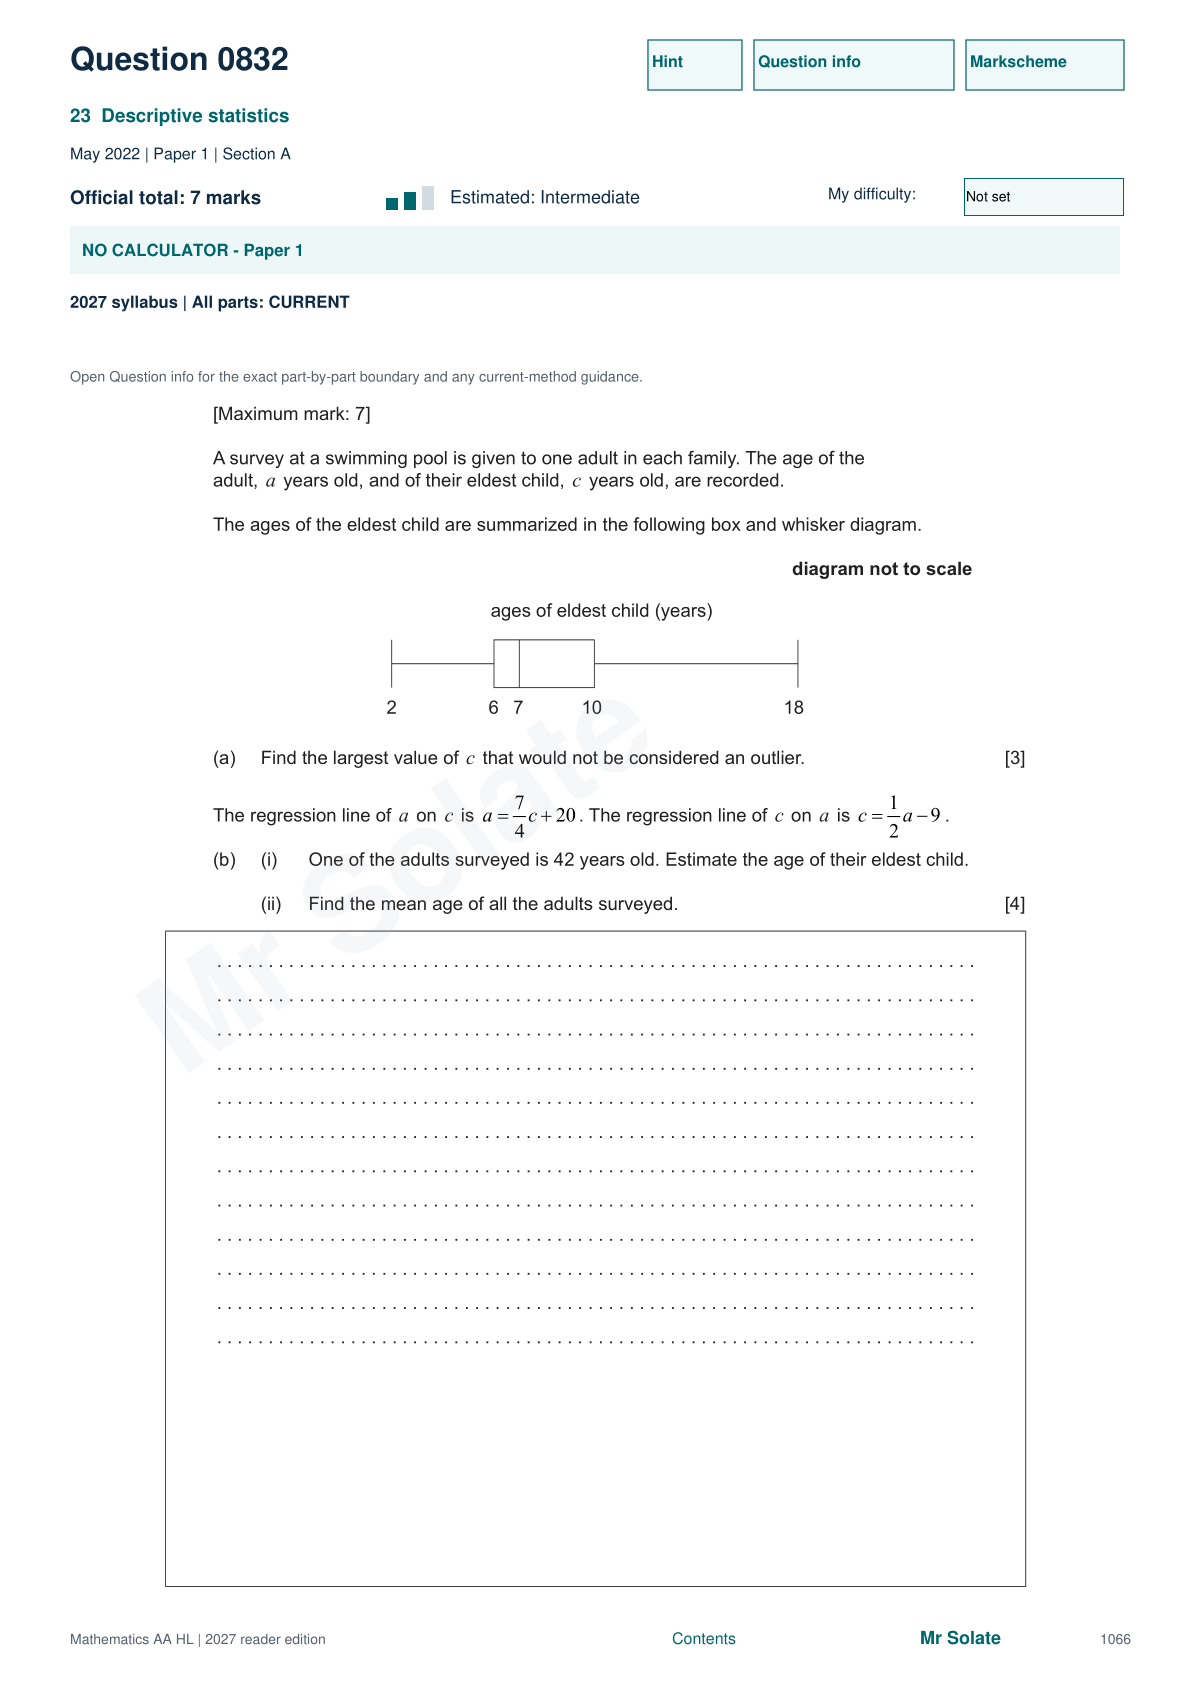
Question 832
Apply the method to the original question.
Compatibility: This current-course AA HL question tests the listed current syllabus methods.
View the original question
Original page images preserve the equations and diagrams. Write your response before revealing the reasoning.
Reveal the revision reasoning
The quartiles are 6 and 10, so IQR=4 and the upper fence is 10+1.5(4)=16 years.
For a=42, use c=a/2-9 to predict c=12 years.
Both regression lines pass through (mean c, mean a). Substitute c=a/2-9 into a=7c/4+20.
This gives a=7a/8+17/4, hence the mean adult age is 34 years; the corresponding mean child age is 8.
Editorial revision reasoning. Check the original answer for its marking detail.
All 43 questions in this topic
Close your notes first
Can you retrieve the method?
1. How do cumulative frequencies become interval frequencies?
Check answer 1
Subtract consecutive cumulative counts.
2. Does adding 5 to every value change standard deviation?
Check answer 2
No; it shifts the mean by 5 but leaves spread unchanged.
3. Which regression predicts x from y?
Check answer 3
Regression of x on y.
Before you move on
- Check whether the requested spread measure uses divisor n or an explicitly supplied n−1 convention; the bank contains older extension questions with different wording.
- Report context and units: standard deviation has the data’s units, while variance has squared units.
Your revision note
Record one missed cue, one corrected step and one question to retry. Saved only in this browser.